The Uptime Institute Cloud Carbon Explorer reveals that organizations can cut both their cloud carbon emissions and costs by moving workloads to different regions. However, the trade off with this migration is an increase in latency. More information can be found here.
Cloud users choose regions based primarily on two factors. Firstly, locating the application close to end users improves the user experience by delivering faster content. Not all applications, however, need such a quick response and end users can often tolerate a slight increase in latency without material impact to their experience. Secondly, offering cloud-based services in a country usually has implications regarding data protection and this can be partly addressed by keeping data within the same jurisdiction as their end users. If there are no legal reasons to keep data in a jurisdiction, cloud users can often migrate their workloads to a nearby region and gain reductions in their carbon footprint; this migration can also result in lower costs.
The Cloud Carbon Explorer maps below show potential cross-region workload migration paths for AWS, Google Cloud and Microsoft Azure. These workload migration paths can reduce carbon footprint without significantly impacting user experience and, in some cases, reduce cost. Users can use the tool to explore suitable compromises of latency, cost and carbon for each application before pursuing their own more detailed assessments.
For example, in the Amazon Web Services explorer below, clicking the Frankfurt bubble shows feasible migration paths in and out of that region. The explorer shows that migrations to Paris, Stockholm, Milan, and London all provide significant reductions in carbon and cost, with a relatively small increase in latency of less than 30 ms. Click on any arrow to see further details.
Questions about Uptime Institute Intelligence?
Fill out the contact form below and one of our Intelligence associates will follow up with you right away.
Tips to Get Started with Cloud Carbon Explorer
Quick Tips
- Choose a cloud provider from the three listed below to start exploring.
- Click regions (circles) for emissions and cost in that region.
- Click paths (arrows) for carbon, cost and latency impacts of that migration path.
- Drag regions to rearrange the elements within the map.
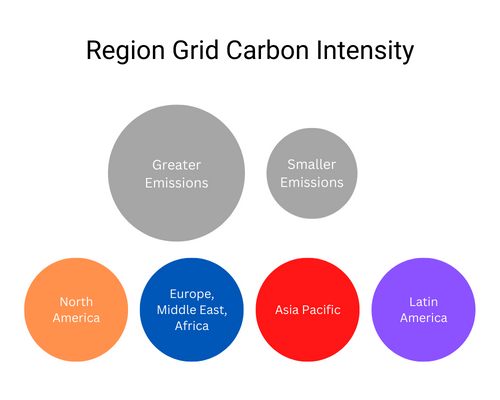
Region Legend
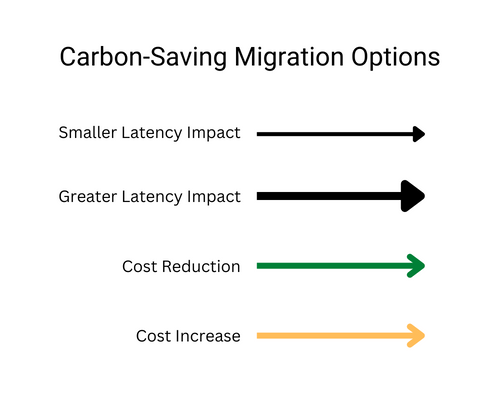
Migration Path Legend
Cloud Carbon Explorer for Google Cloud
- Data Sources
- Latency: https://datastudio.google.com/u/0/reporting/fc733b10-9744-4a72-a502-92290f608571/page/70YCB
- Pricing: https://cloud.google.com/compute/vm-instance-pricing
- Grid emissions: https://github.com/cloud-carbon-footprint/cloud-carbon-coefficients/tree/main/data and https://www.cloudcarbonfootprint.org/
Cloud Carbon Explorer for Amazon Web Services
- Data Sources
- Latency: https://www.cloudping.co/grid
- Pricing: https://aws.amazon.com/ec2/pricing/on-demand/
- Grid emissions: https://github.com/cloud-carbon-footprint/cloud-carbon-coefficients/tree/main/data and https://www.cloudcarbonfootprint.org/
Cloud Carbon Explorer for Microsoft Azure
- Data Sources
- Latency: https://docs.microsoft.com/en-us/azure/networking/azure-network-latency
- Pricing: https://azure.microsoft.com/en-gb/pricing/details/virtual-machines/windows/
- Grid emissions: https://github.com/cloud-carbon-footprint/cloud-carbon-coefficients/tree/main/data and https://www.cloudcarbonfootprint.org/
provided by UPTIME INSTITUTE INTELLIGENCE
This tool is just one of a number of resources provided by Uptime Institute Intelligence.The Uptime Institute Intelligence practice is dedicated to identifying, analyzing, and clearly explaining the trends, technologies, and changing business of the mission-critical infrastructure industry, so that our clients may make considered, well-informed decisions, explore new opportunities, and reduce their exposure to risk.
LEARN MORE ABOUT UPTIME INSTITUTE INTELLIGENCE